3 Key Google Analytic Reports To Help Improve Your Results (Part 2)
Welcome to Part 2 of our 3 part series on how to improve your results using Google Analytics. Last week we looked at the Acquisition Report. If you missed Part 1, you can find it here.
This week we are giving a rundown of the Behaviour Report.
 The Behaviour Report
The Behaviour Report shows which pages people visit and how they interact with these pages. You can use data from the Behaviour Report to determine the effectiveness of your content.
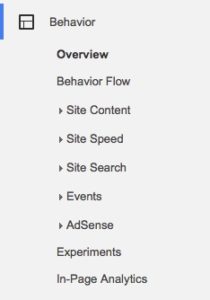
After selecting Behaviour from the menu, you can choose from nine options.
“Overview” Stats
The Overview option is a convenient way to check some of the most important Behaviour stats. At the top of the screen, you’ll see a graph showing how many Pageviews your site has received over time.
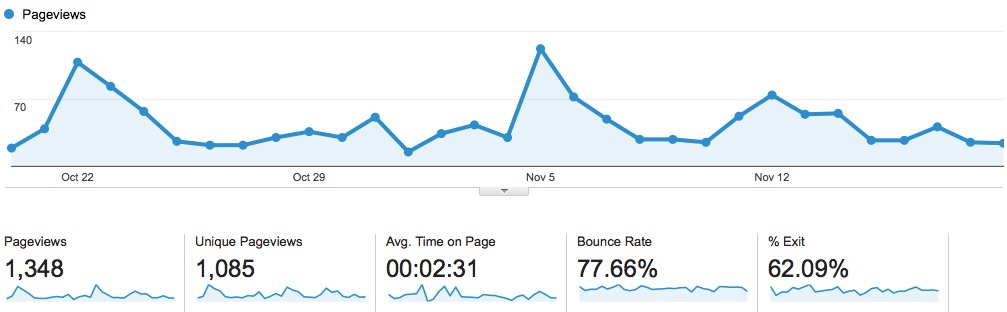
Below this, you will see the following:
- Pageviews: the overall number of pageviews, including repeated views of the same page.
- Unique Pageviews: the number of unique visits to a specific page. Unlike Pageviews, Unique Pageviews do not count repeated visits to a single page.
- Time on Page: the average duration of a visit on a specific page.
- Bounce Rate: the number of single-page visits. If a visitor leaves your website on the same page they entered on, that is a bounce, and is used to determine the Bounce Rate.
- % Exit: the percentage of visitors who exit from a specific page.
“Behaviour Flow”
The Behaviour Flow is a visual breakdown of the path visitors take on your website. You can see the most common landing pages (the pages that visitors view first), and most common exit pages.
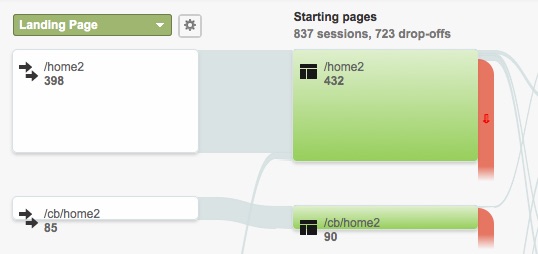
This flow chart can help you see which pages encourage click throughs. In other words, it shows which pages generate enough interest to keep visitors wanting more.
For example, a page of testimonials from clients may encourage a visitor to click through to a contact page or a purchase page.
“Site Content” Stats
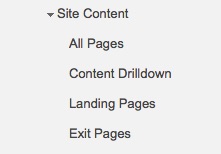
The Site Content option is broken down into four reports.
All Pages
The All Pages report is a quick way to see the most visited pages of your website, as well as the Average Time on Page, Entrances, Bounce Rate, % Exit and Page Value.
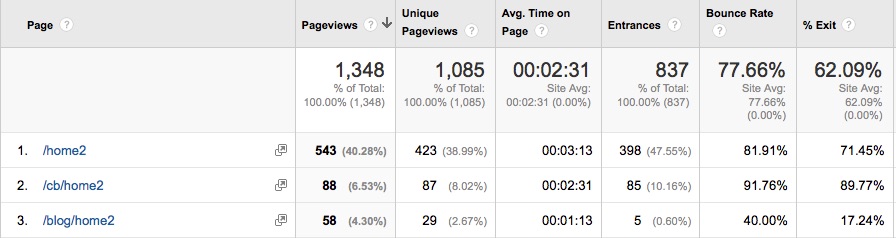
Use this information to see which content performs the best.
Landing Pages
The Landing Pages report shows the most common pages that visitors enter your website on.
Using the additional data you can determine which pages are most effective at generating leads. For example, if a particular post on your blog has a low Bounce Rate, you know that visitors were engaged with the content and wanted to read more.
Exit Pages
The Exit Pages reports reveals the most common pages that visitors leave your website on.
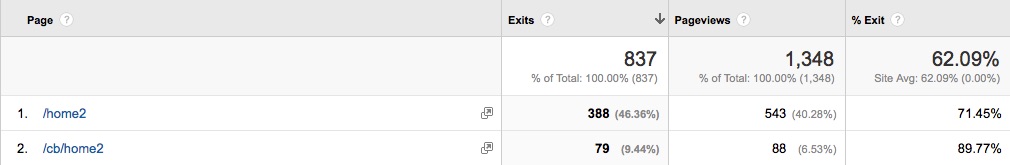
It’s a good idea to take a look at these pages and see what you can change to encourage visitors to stay longer. For example, adding more links to these pages will guide visitors to other pages.
It’s also worthwhile making sure that your exit pages have a clear call to action, such as a way to subscribe to your email newsletter, or a button to follow you on social media. That way, visitors can keep up-to-date with your business after leaving your site.
“Site Speed” Stats
A slow loading page may be frustrating for your visitor. Use the Site Speed report to find out which areas of your site have a higher-than-average loading time and need optimising.
Site Speed Overview
The Site Speed Overview report shows a range of graphs, including:
- Page Load Time: the average number of seconds it takes for a page to load completely.
- Server Response Time: the average number of seconds it takes for your server to initiate a visitor’s action.
- Page Download Time: the average number of seconds it takes to download a page.
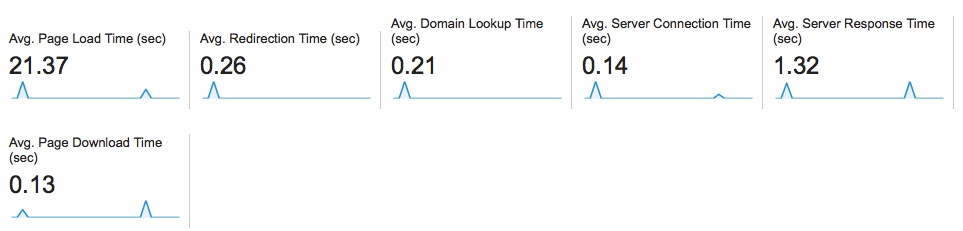
This data can help you improve the speed of your site, making it a more pleasant experience for visitors. The most common issue with slow speed – like in the example provided above - is large images – so make sure you optimize them – by trying to keep the file size as small as possible, but without pixelation. Under 75k or even 50k is optimal.
Speed Suggestions
For more help on improving the speed of your site, visit the Speed Suggestions option.
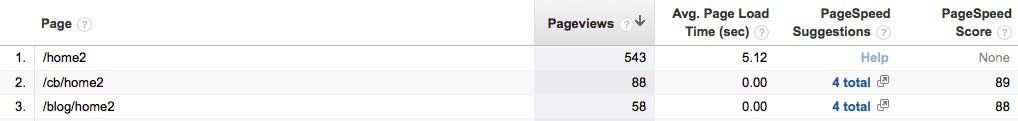
Here, Google will give your most popular pages a score out of 100 called a PageSpeed Score: the lower the score, the greater the ability to improve the speed. A high score indicates that there is little you can do to improve the load time of a page. By clicking on the PageSpeed Suggestions, you can find how to improve the speed of a particular page.
Key Google Analytics Report No 3
Join us next week for Part 3 – a rundown of the Conversion Reports!
Can You Help Us?
How would you like to attend a webinar to find out more on how to use Google Analytics Reports to improve your business results? Click here and let us know.