3 Key Google Analytic Reports To Help Improve Your Business (Part 3)
This week we will be going through the final key Google Analytic Report that you can use to improve the results of your business. In Part 1 we looked at the Acquisition Reports, and in Part 2 we looked at the Behaviour Reports.
This week we will give you a rundown of the Conversion Reports.
The Conversion Reports
 A conversion occurs when a visitor completes an action on your website. There are two types of conversions: a Goal conversion (e.g. signing up to a newsletter) and an Ecommerce conversion (e.g. buying a product). These conversions are very important to the success of your website. Use the information from the Conversion Reports to determine how well your website is performing.
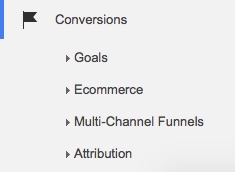
To access the Conversion Reports, select it from the menu. You can choose from four options.
“Goals” Stats
Goals are the primary way you can measure how well your website fulfils its objectives. A Goal conversion occurs when a visitor completes a desired action on your website. You can use this information to determine how well your web design and content encourages visitors to sign up for your newsletter, download your podcast, purchase your product etc.
Goals can help you improve the effectiveness of your website. For example, if your traffic has increased over the past month, but your email subscriptions have remained the same, you may need to make the subscription button more obvious and appealing, or add a stronger call to action.
In order to track Goal conversions, you need to set them up in Google Analytics. You can find comprehensive information about how to set up a Goal here.
Overview
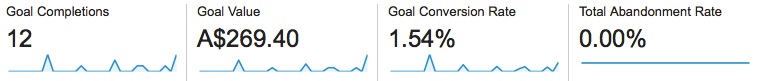
The Goals Overview option will show you how many goals have been completed, the monetary value of completed goals, the Goal Conversion Rate, and the Total Abandonment Rate followed by statistics specific to the goals you have set up.
Below this you will see a table detailing where on your website the conversions occurred.
Goal URLs
This option gives a more detailed overview of the pages on your site that have produced conversions.
Use this information to determine what encourages visitors to complete a desired action. For example, if you have had a large number of people sign up to your newsletter from your About Us page, look closely at the page and determine why this might be. Have you got extra ways to sign up on this page? Is the content particularly persuasive?
Reverse Goal Path
The Reverse Goal Path shows the step-by-step movements of your visitor before the complete a desired Goal.
Goal Flow
The Goal Flow can help you see how users arrive at a Goal. Where do they start? Do they skip any steps? Is there one particular path of navigation that produces more traffic than others?
How to Improve Your Goal Conversions
- Goal – Email capture: Give your visitor something in return for them sharing their email details. Ask yourself “What valuable information can I share to tempt them to provide their name and email?” Make sure the steps to signing up are clear, minimal and easy to follow.
- Goal – An event like playing a video, or calling your phone from their mobile device: Make it easy for your visitors to do these things and test changes to elements to see if you can get more conversions
- Goal - Online purchase: Review your shopping cart process and ensure there’s not too many steps. Test different buttons, test bundle buys, test promo codes, test upsells.
“Ecommerce” Stats
The Ecommerce reports show you what your visitors purchased. Use this information to determine which products are popular and which need some work to lift sales.
You will need to set up e-commerce data collection on Google Analytics. For detailed information on how to do this, click here.
Overview
The Overview option gives you statistics on the Conversion Rate, Transactions, Revenue, Average Order Total, Unique Purchases and Quantity.
Use this page as a quick and easy way to track conversions and sales volumes.
Product Performance
The Product Performance option shows which products are being purchased and in what quantity.
Use this information to determine your most popular products.
“Multi-Channel Funnels” Stats
The Multi-Channel Funnels shows how different channels work together to produce conversions. You can look closely at your visitor’s conversion paths – ie: the steps they took before they took the action you wanted them to.
Keep in mind that customers may visit your site multiple times before deciding to take action. For example, they may find you through a Google search and then again later via your Facebook ad.
Top Conversion Paths
This page shows the number of unique ways your customers reached a conversion. Use this information to track your most effective content and/or advertising.
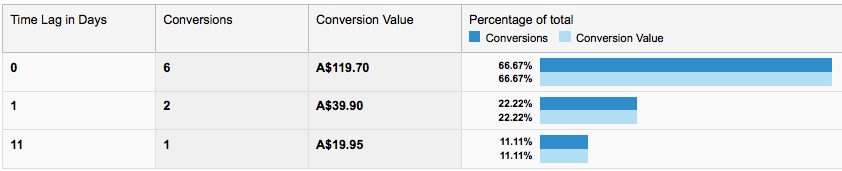
Time Lag
People don’t always make a conversion on their first visit to your site. The Time Lag report shows how long it takes for a customer to make a conversion.
Want to Know More?
There are so many ways to use Google Analytics to track the performance of your website. If you are interested in attending a webinar on Google Analytics, please click here.